Octave is a MatLab-compatible interpreter, which uses
Gnuplot to display graphics. I'll now show you how to capture the commands sent from Octave to Gnuplot. This is useful for learning how to drive Gnuplot, among other uses.
First, launch Octave, and then enter the following command:
octave> plot(sin(0:0.1:30),'LineWidth',3)You can now regenerate this plot, but direct the plotting commands to a file:
octave> drawnow("svg", "drawing.svg", false, "drawing.gp")In this case, we've chosen the SVG "terminal", so that a scalable-vector-graphics image is created in the current directory. The Gnuplot commands used to create this image can be found in the drawing.gp file.
Here's the drawing.svg image:
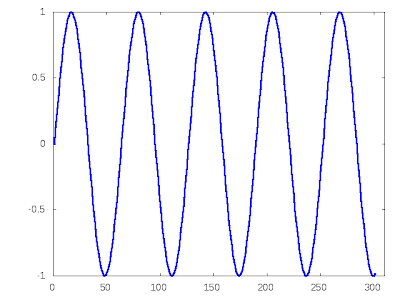
(blogger.com wouldn't actually let me upload an .svg, so I had to render it to a .png first, but you get the idea)
In another terminal window, you can feed the Gnuplot commands to Gnuplot, to recreate this image:
> gnuplot drawing.gpIf you don't want to create an image file, but instead want to view the image in a window, do this instead:
octave> drawnow("x11", "/dev/null", false, "drawing.gp")Then launch Gnuplot, and enter this command:
gnuplot> load 'drawing.gp'Whala!


