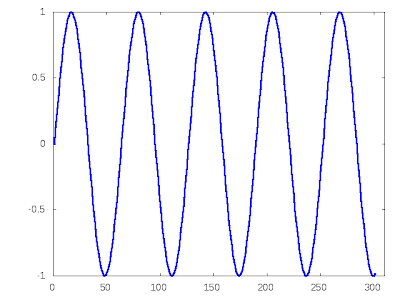
First, launch Octave, and then enter the following command:
octave> plot(sin(0:0.1:30),'LineWidth',3)
You can now regenerate this plot, but direct the plotting commands to a file:
octave> drawnow("svg", "drawing.svg", false, "drawing.gp")
In this case, we've chosen the SVG "terminal", so that a scalable-vector-graphics image is created in the current directory. The Gnuplot commands used to create this image can be found in the drawing.gp file.
Here's the drawing.svg image:
 (blogger.com wouldn't actually let me upload an .svg, so I had to render it to a .png first, but you get the idea)
In another terminal window, you can feed the Gnuplot commands to Gnuplot, to recreate this image:
> gnuplot drawing.gp
If you don't want to create an image file, but instead want to view the image in a window, do this instead:
octave> drawnow("x11", "/dev/null", false, "drawing.gp")
Then launch Gnuplot, and enter this command:
gnuplot> load 'drawing.gp'
Whala!
No comments:
Post a Comment